Sharepricer Example
Here is an example how to enter the data for an imaginary high tech company called "Company A".
From the main window, press the
Add button to create a new company. A new company information window opens and you should enter the name of the
company to the first field of the new window.
We find from a newspaper or from the internet that the share price of Company A is $30.5 in the markets and enter that to the market price field.
(It is also possible to enter the stock ticker symbol and let the program get the price by pressing Fetch Price button.)
Now click the Valuation Inputs tab.
Use value "Custom" in the Quick select field to enable advanced valuation.
We find out from the annual report that previous year
earnings
were $0.5 per share. The company did not pay any dividends, because all earnings were invested to future
growth. We estimate that in the long run the company pays out 35% of it's earnings. Let's insert "35" to the
dividend ratio field.
Then we must determine the cost of equity. There are several methods for this. We could get the share
beta from some web site that collects market data
(for example Yahoo!), then use that to calculate the cost of equity. We could also find cost of equity figures from an analyst site or from an analyst report of Company A. In this case we find such a report that estimates the
cost of equity for Company A to be 11% and insert "11" to the cost of
equity field. It's a good idea to insert the date and information source to the comment field.
The earnings estimates of large corporations are easy to find. Many
websites (for example Yahoo!) publish consensus estimates.
We find out that the consensus estimate for this year is $0.9, and for the next year
$1.3. Let's enter "0.9" to the first earnings field. If the next year has
earnings change field active, we must use the radio button to indicate that we want to
enter the exact earnings figure and not the earnings change figure.
Once the earnings field for next year is active, let's enter "1.3" into that field.
To the comment fields we again enter the date and source of information.
Suppose we can not find earnings estimates for the rest of the years. The program shows us that the
earnings growth for next year is 44%.
We estimate the earnings growth still to be 20% and 15% for the following two years after that.
We must activate the growth fields and enter "20" and "15" for those fields (for the two years after the 44% figure). This time it
could be logical to leave the comment field empty, as the estimate was
based mostly on our intuition.
Based on our knowledge of the business, we estimate their earnings to
grow 9% per year after that. Use the Remove-button to remove years until the long term
growth line is next to the line where we just entered "15". This means that there are five visible earnings
rows in total, including the long term growth row.
Then, enter "9" to the long term growth field.
Now the share value field shows the intrinsic value of the share.
It depends on the current time of year, but should be somewhere around $25.
The Growth property tells us what growth figure in the long term
growth field would produce the share value to equal the market price ($30.5).
The required growth can be compared with other companies. This way we might see that one company is overvalued or undervalued compared to another.
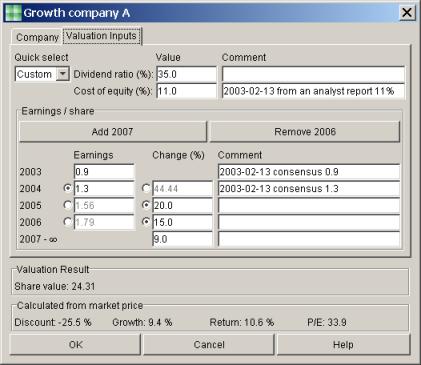
Here is how the window looks with these values:
This page was updated: 2003-05-01 Site update history
|

