Sharepricer Details
The calculations of Sharepricer are based on the concept of economic profit.
In general, the following inputs are needed for economic profit calculations:
- cost of equity
- shareholders' equity (net assets)
- future earnings estimates
To be able to correctly calculate the shareholders' equity in the future, we also need to know the dividend ratio (payout ratio) of the company. Also, for our purposes, the initial amount of equity is not needed, because it does not affect the share value. If company has high amount of equity, it's future earnings are valued exactly that much lower, and vice versa. This effect enables us to eliminate shareholders' equity from the inputs.
This leaves us with the following inputs:
- cost of equity
- dividend ratio
- future earnings estimates
Below is a picture of an analysis of a high tech company called "Company A".
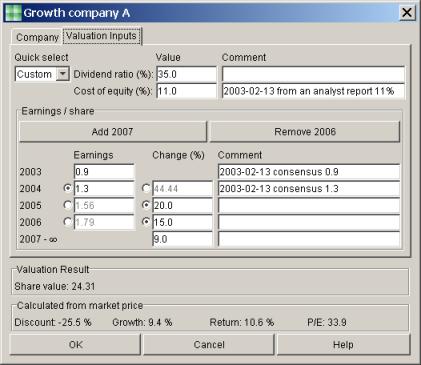
How did we get and input these values?
So the result was that share value is 24.67 (dollars, assuming that the earnings were given in dollars). Now we can input the current market price of the share. Based on that the program automatically calculates the P/E ratio, and the amount of long term growth that is required from the company for it to be worth the market price (Required growth).
Pressing OK brings us back to the main window. There we can easily compare the companies. By clicking the table headers, the companies can be sorted based on the following criteria:
- A user defined order that can be used, for example, to enter the latest market prices
- Alphabetically by name
- Discount (how much cheaper is the market price than the estimated value)
- P/E ratio
- Required growth, a very powerful figure that takes into account all the most important fundamentals of the company
- Modification dates of analysis or market price
Here is an example of how to quickly find buying opportunities even if you have not updated your data for a while:
- Update market prices: Sort the table by the market price update timestamp to find market prices that are badly out-of-date.
- Update analysis: Sort the table by the analysis update timestamp. Often a more effective way is to sort the table by the Discount column. Large positive or negative values of Discount may be good indicators of companies that have out-of-date analysis. This method requires that market prices are updated first and that you always match the value estimate to the market price when doing an analysis. (There are also other ways to make an analysis.)
- Sort by Required growth. The value stocks should have a small required growth and the growth stocks should have a large one. Try to find either a growth stock among the value stocks or a value stock with a very small required growth.
Below is a picture of the main window:
Next - Free Demo
This page was updated: 2003-05-01 Site update history
|

